Why Business Intelligence Fails (and How to Fix It)
Business intelligence (BI) adoption is often seen as the answer to data chaos, yet many organisations invest in BI only to find that leaders still question the numbers, managers revert to Excel, and real business impact remains elusive. Data suggests that between 50% and 80% of BI and analytics initiatives fail to deliver their intended business value. This sobering statistic highlights the need for a different approach.
So why does business intelligence fail? Frequently, it’s not the technology itself, but a lack of alignment with business needs, poor data quality, or limited user adoption that undermines success. The true cost of failed BI isn’t just wasted software spend but the lost trust, missed opportunities, and decision paralysis. To turn BI into a genuine driver of clarity and action, you need a framework that embeds adoption at every step, ensuring your investment delivers measurable results.
The Real Cost of BI Failure — and the
Business Intelligence Adoption Framework That Prevents It
Step 1: Align BI Goals with Business Strategy
A well-designed BI implementation framework begins here. Before you log into a tool or load a dataset, pause. One of the main reasons BI fails is that it’s implemented without a clear business purpose. Are you trying to:
- Reduce manufacturing bottlenecks?
- Improve profitability visibility across regions?
- Help managers make better inventory decisions?
- Get faster feedback on sales campaigns?
When BI is disconnected from strategy, it becomes a data dump. But when it’s aligned, it becomes a driver of clarity and action.
What this looks like in practice:
One client came to us wanting “a sales dashboard.” We asked why and after some digging, realised their real challenge was forecasting. The dashboard became just one piece of a broader solution to improve decision-making around stock planning.
Takeaway: Aligning BI with business strategy is the foundation for adoption and long-term impact.
Step 2: Assess Your Current Data Landscape
Once your goals are clear, take stock of your data reality:
- Where is your data stored?
- How clean or consistent is it?
- Are key metrics defined and trusted?
- Who “owns” the data in each department?
This step helps you surface potential roadblocks early. You might realise that your sales data is great, but your finance data is messy. Or that your CRM captures customer names five different ways. You can’t build trusted reporting on top of chaos, ensure you fix what needs fixing before you scale.
Tip: Map out a few high-priority reports and trace where every number comes from. It’ll expose gaps fast.
Takeaway: A clear, accurate data landscape is essential for successful business intelligence adoption.
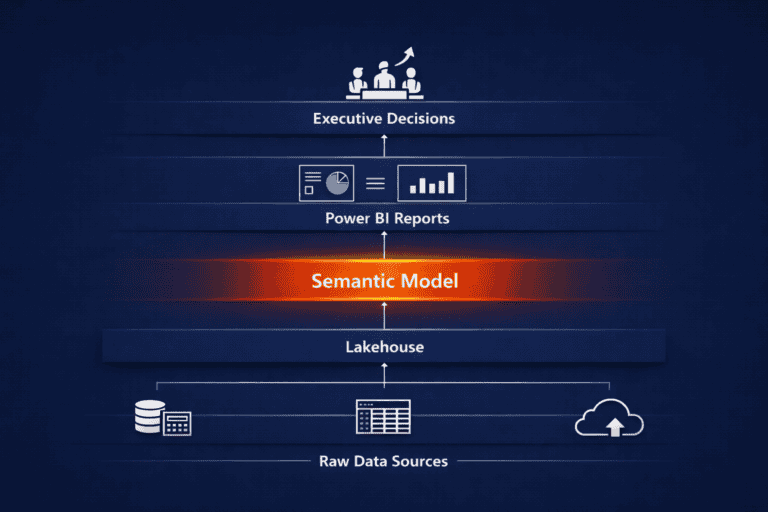
Step 3: Build a Scalable Semantic Data Model for BI Implementation
Use a Semantic Data Model to provide structure
A scalable semantic data model provides the structure your business intelligence adoption needs to succeed. This model defines how your data tables connect, which metrics are calculated, and what logic powers your reports. It’s the beating heart of your BI system.
Many in-house BI efforts fail here: reports are built directly on raw data, with no centralised logic or structure. The result is inconsistent numbers, bloated files, and no version control. Successful BI implementation hinges on building a robust semantic data model. By centralising calculations, relationships, and business logic you ensure consistency and scalability across all reports. To learn more, check out our blog What is Semantic Modelling in Power BI
What to do:
- Centralise your calculations (KPIs, filters, hierarchies)
- Create relationships between key tables (e.g. sales, customers, products)
- Choose tools that support scalable models (like Microsoft Fabric)
What not to do:
- Hard-code formulas into every report
- Allow every team to define their own version of “net revenue”
Takeaway: A strong semantic data model is essential for consistent, scalable, and trusted business intelligence adoption.
Step 4: Design Dashboards That Tell a Story
With your semantic data model in place, it’s time to visualise your insights. But don’t just throw charts on a page, think like a product designer. Effective dashboards are central to business intelligence adoption because they:
- Guide attention to what matters most
- Answer specific business questions, not just display data
- Prioritise clarity over complexity
At SeedGrowth Analytics, we use the “Decision Lens” approach: every dashboard is anchored to a key decision. Ask, “What decision is this dashboard helping someone make?” and let that guide your layout, filters, and visual hierarchy.
Example:
A regional manager doesn’t need to see all customer data, they need to know which stores are underperforming and why, so they can take action. Build the dashboard for that purpose.
Takeaway: Dashboards designed around real decisions drive adoption and turn data into action.
Read more about Power BI dashboard best practices here.
Step 5: Train Users and Embed BI Into Workflows
This is the step that fixes the adoption gap we mentioned earlier, the very gap that sinks many BI projects. Even the best dashboards are useless if no one uses them. Adoption doesn’t happen by accident; it needs to be designed.
Here’s how:
- Run onboarding sessions focused on use cases, not features.
- Create champions in each department who can support others.
- Link reports to existing workflows (e.g. morning standups, weekly reviews).
Real-world insight:
One of our South African based clients added their BI dashboards to weekly sales huddles and exec check-ins. Over time, the team stopped asking for spreadsheets and trusted the dashboards because they were baked into how they worked. It also made the meetings more focused and helped the teams focus on solutions rather than arguing over the numbers.
Step 6: Monitor, Iterate, and Support
Implementation doesn’t end with the launch. In fact, that’s when the real work begins.
Keep a pulse on:
- What’s being used (and what’s not)
- Where users get stuck
- Which requests keep popping up
Use this feedback to refine your dashboards, improve the model, and strengthen your training. Your BI setup should evolve with your business; it shouldn’t stay frozen in its initial form.
Pro tip: Create a BI feedback channel (Teams, Slack, email) where users can ask questions, suggest improvements, or flag data issues.
Think Data Culture, Not Just BI Tools
Tools are easy to buy but culture is harder to build. If your team still defaults to gut feel, or if data always plays defence instead of driving action, it’s likely a cultural gap, not a technical one.
What builds a data culture in business intelligence?
- Leaders using dashboards in meetings
- Managers asking data-first questions
- Access to data without bottlenecks
- Celebrating data wins (not just reporting errors)
Our experience:
One CFO we worked with started every exec meeting by asking one data-driven question. Within a month, the whole leadership team shifted from anecdotal updates to evidence-based thinking. That’s culture change in motion.
Recap: Your BI Implementation Checklist
How to avoid the classic reasons BI implementation projects fail:
- Align reporting with business strategy.
- Audit your current data landscape.
- Build a strong, centralised semantic model.
- Design dashboards with a clear decision in mind.
- Train users and bake BI into workflows.
- Monitor usage and improve continuously.
- Invest in culture, not just tech.
Closing Thought: Build with Intention
Rolling out BI isn’t about ticking a box or chasing a trend. It’s about building the systems your business needs to see clearly, move faster, and lead with confidence. That only happens when you implement with intention; one aligned, informed step at a time.
Dashboards don’t drive decisions, people do. Give them data they can trust and use, and you’ll see how BI becomes your competitive edge.
Need help getting your BI off the Ground?
Our business intelligence consulting team can support you. We help growing businesses build BI systems that make sense not just for analysts, but for decision-makers.
Let’s talk through where your rollout might be stuck.
FAQ
Why do BI projects fail most often?
Most BI projects fail because adoption is overlooked; tools are implemented without aligning with business strategy or embedding into daily workflows. When leaders and managers don’t trust the numbers or revert to old habits like Excel, it’s usually a sign that the BI solution wasn’t designed with their real decision-making needs in mind. At SeedGrowth Analytics, we focus on aligning BI with business goals, building trust in the data, and ensuring adoption is part of the plan from day one.
How do I get managers to use dashboards instead of Excel?
The key is to design dashboards that answer specific business questions and fit seamlessly into existing workflows. We recommend involving managers early, training them on real use cases (not just features), and linking dashboards to regular meetings and reviews. When dashboards become the go-to source for answers and are easier to use than Excel, adoption follows more naturally.
What’s the ROI of a successful BI rollout?
A well-implemented BI solution delivers ROI through faster, more confident decision-making, reduced manual reporting, and improved data accuracy. Our clients have seen measurable benefits such as a significant reduction in ad hoc report requests, better forecasting, and more focused meetings. The true value comes when BI shifts from being a reporting tool to a driver of business action and clarity.
How do I choose the right BI tool for my business?
Start by clarifying your business goals and the decisions you want to support. The best tool is one that integrates with your data sources, supports scalable data models, and is user-friendly for your team. At SeedGrowth Analytics, we often recommend solutions like Power BI for its flexibility and strong modelling capabilities, but the right choice always depends on your unique needs and existing systems.
How long does it take to see value from BI?
Value can be realised quickly when BI is implemented with intention. By focusing first on high-priority reports and embedding BI into key workflows, many organisations see improvements within weeks of rollout. The most sustainable results come from ongoing iteration by monitoring usage, gathering feedback, and continuously refining dashboards and data models as the business evolves.
Rachel O’Connor is Co-Founder and runs Operations at SeedGrowth Analytics. She focuses on building people, process and purpose into the heart of the business so that data delivery is consistent, scalable and trusted across clients. Her interest is in how data gets used, how people make decisions, and what it takes to turn insight into action in real business environments. She writes about how organisations build clarity through disciplined execution, not just better tools. Connect on LinkedIn