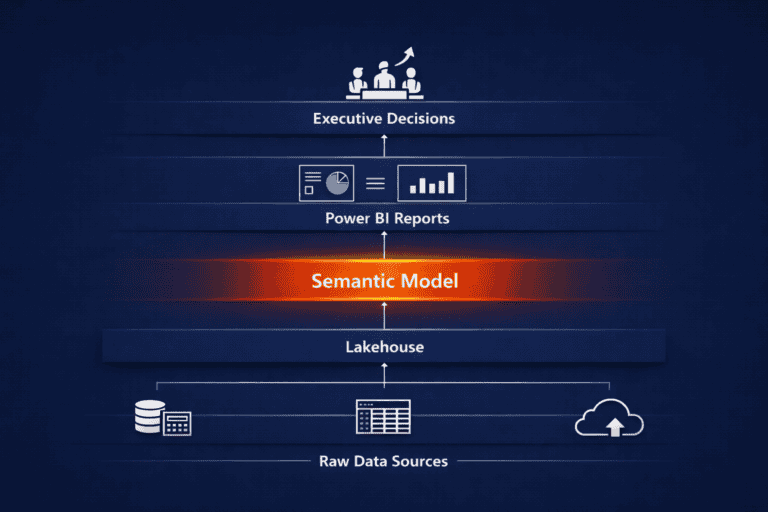
AI Business Intelligence and the Data Maturity Curve
AI business intelligence is no longer a future concept, it is reshaping how forward-thinking organisations move from data overload to confident, proactive decisions.
This is your guide to the future of Business Intelligence from generative AI and embedded BI to agentic workflows and proactive decision-making. Using our SeedGrowth Analytics Data Maturity Curve, we’ll help you plot a journey that builds towards AI-powered insight.
Dashboards Aren’t the Destination
Many organisations today have a functioning BI system. Dashboards are live, often built in tools like Power BI. Reports refresh on schedule and analysts produce monthly summaries.
But if decisions are still based on gut feel, if reports surface problems too late, and if users struggle to find meaning, then the system isn’t doing its job as part of a broader business intelligence strategy.
That’s where the SeedGrowth Analytics Data Maturity Curve comes in.
Introducing the SeedGrowth Analytics Data Maturity Curve
At SeedGrowth Analytics, we help businesses assess and grow through four stages of BI maturity using our data maturity assessment:
Stage 1 | Reactive Reporting: Reporting without reliability
You’re pulling ad hoc reports, mostly from spreadsheets. Data lives in silos. Reporting is slow and manual.
Stage 2 | Organised BI: From Tools to Trust
Dashboards are built, and reports are automated. You’ve started cleaning and centralising your data, but metrics can still be inconsistent. Analysts are spending too much time fixing data, not analysing it.
Stage 3 | Strategic Analytics: From Trusted to Future-Proof
You have centralised data models. Leadership trusts the numbers. BI supports monthly planning, but insight still arrives after the fact.
Stage 4 | Proactive Insight: Predictive & AI-Ready
Your BI system predicts, alerts, and recommends. Insight is real-time. Users ask questions in plain language. Data is embedded in decision-making across the business.

Most businesses we meet are somewhere between Stages 1 and 3. They’ve done the hard work of building dashboards, but they haven’t yet unlocked the full potential of next-generation BI.
Here’s how the latest trends in BI map to that journey, and how to use them to move toward Stage 4 | Predictive & AI-Ready.
Trend 1: Generative AI for Business Intelligence — from Data to Insight
At Stages 2 and 3, analysts still spend time summarising reports, writing commentary, or responding to exec requests. With generative AI, those insights can be surfaced automatically, saving time, reducing bottlenecks, and making dashboards more valuable for decision-makers.
What this looks like:
- Narrative explanations auto-generated next to charts
- Anomalies or trends flagged without prompting
- Executive summaries pulled from multiple data models in seconds
Why it matters:
This shifts BI from reporting, to decision support. With AI-powered BI, dashboards don’t disappear; they evolve. Generative AI turns them from static displays into living insight engines, where meaning is surfaced instantly instead of waiting for human interpretation.
Trend 2: Natural Language Querying — Make Data Accessible to All
At Stage 3, data is structured. But many users still rely on analysts to pull answers.
Natural language tools change that. Although in its infancy, business users can type natural questions into data platforms and get real answers, fast. It should be noted that currently this process is in its infancy, but advancing rapidly.
What this unlocks:
- BI adoption beyond the analyst team
- Self-serve insight that reduces bottlenecks
- Faster decision-making at every level
This shift from analyst-gated data to company-wide access is one of the clearest signs of progress up the data maturity model, and one of the most visible wins executives will highly value.
This is key to moving beyond the “reporting centre” model and embedding BI adoption across teams.
Why it matters:
Natural language doesn’t replace dashboards, it extends them. By making data accessible in plain day-to-day language, BI shifts from an analyst-only tool to a company-wide decision driver.
Trend 3: Real-Time Dashboards — From Insight Lag to Instant Clarity
At Stages 2 and 3, reporting often runs on daily, weekly or monthly cycles depending on the speed of decision making. But by the time trends appear, the moment to act has passed.
Real-time BI flips this. Combined with predictive analytics leaders can spot issues as they emerge and respond immediately.
Use cases:
- Logistics teams rerouting deliveries based on live delay data
- E-commerce managers adjusting campaigns mid-launch
- Customer service teams reallocating staff based on volume
Why it matters:
Dashboards stop being rear-view mirrors. With real-time streams, they become live command centres, allowing leaders to act as events unfold instead of reacting after the fact.
Trend 4: Embedded BI — Bring Insight into the Workflow
BI adoption doesn’t just depend on data quality. It also depends on convenience.
At lower maturity Stages, BI is a destination where users must open Power BI or Tableau to “go look.” But in modern, embedded BI, insight lives inside the tools your team already uses: CRMs, ERPs, internal portals like Microsoft Teams or Microsoft Fabric-based solutions.
This does two things:
- Reduces friction to access and interpret data
- Embeds insight into decision moments, not just dashboards
This is key to sustaining adoption as your BI maturity increases.
Why it matters:
Dashboards no longer require a special trip. By embedding insight into the tools teams already use, BI stops being a reporting destination and becomes part of everyday decision-making.
Trend 5: AI-Powered Real-time Forecasting & Scenario Modelling — Future-Proof Your Strategy
At Stage 4, BI doesn’t just report on the past but anticipates what’s coming. All the time. With specialist forecasting and scenario planning data agents, teams can, in real-time:
- Predict revenue or churn with confidence intervals
- Test pricing changes, budget scenarios, or hiring plans
- Blend internal data with external trends (e.g. inflation, market volatility)
It should be noted that these are currently in their infancy and should be piloted thoroughly before rolling out.
Why it matters:
Proactive businesses don’t wait for reports. With forecasting and scenario planning built in, they become decision simulators, letting leaders test strategies before they commit as part of a more resilient business intelligence strategy.
Trend 6: Agentic Workflows — The Next Frontier of AI Business Intelligence
The future of BI isn’t just about showing you what’s happening. It’s about doing something about it. Agentic workflows use AI “agents” that don’t just analyse data; they trigger actions, recommend responses, and even execute tasks under human oversight.
What this looks like:
- A sales agent that flags churn risk and drafts a retention plan.
- An ops agent that spots low stock and auto-generates a purchase order.
- A finance agent that highlights cash flow pressure and models cost-cutting options.
Again, it should be noted that these solutions are currently in their infancy and should be piloted thoroughly before rolling out.
Why it matters:
Agentic workflows shift BI from insight to action. This is the next evolution of AI-powered BI, where insight doesn’t just inform decisions, it helps execute them.
The Risk of Skipping Ahead
Everyone wants to jump to GenAI and agentic workflows.
BUT
If your data isn’t trusted at Level 2–3 of the data maturity curve, AI won’t fix, it but it will amplify whatever is there.
The lesson for CEOs: Nail your foundations first. Only then can AI become a growth driver instead of a liability.
How to Build a Business Intelligence Strategy Without Rebuilding Everything
The good news is that you don’t need to rebuild your whole BI stack to start moving forward.
Here’s how to take the next step:
✅ 1. Get Honest About Where You Are
Use the maturity curve to diagnose your current state. Where are the gaps? Identify them in data trust, speed, accessibility, and action.
✅ 2. Pick One Use Case
Start small. Choose one process like sales forecasting, customer retention, or stock movement, and test a next-gen approach there.
✅ 3. Strengthen Your Foundation
Most Stage 4 systems are built on structured, governed, clean data. If that’s shaky, start there. Without it, AI will only amplify the mess.
✅ 4. Design for Humans
Adoption isn’t about complexity. It’s about clarity. Use natural language, embed insight into workflows, and build tools your team wants to use.
Key Takeaways
Here’s a recap of how to strengthen your business intelligence strategy and harness the power of AI business intelligence:
- Define your BI vision: Clarify the business decisions and outcomes you want AI-powered BI to support before adopting new tools.
- Assess your data maturity: Evaluate your current data structure, trust, and accessibility to identify where you stand on the maturity curve.
- Embed insights into workflows: Integrate BI directly into daily tools and processes so teams act on data, rather than just viewing it.
- Empower all users: Use natural language and self-serve BI features to make data accessible beyond analysts.
- Strengthen your data foundation: Prioritise clean, governed, and reliable data. AI and advanced analytics only add value when the basics are solid.
Closing Thought: Dashboards Aren’t Dead — They’re Graduating
Dashboards aren’t going away. They’re evolving into something smarter, faster, and more proactive. The question for executives isn’t “are my dashboards useless?” it’s “is my business ready for the next step?”
Leaders who invest in clean sources, trusted models, and user adoption can start to unlock GenAI, real-time BI, and agentic workflows as true growth drivers. Those who don’t, risk being left with pretty charts that will never drive change.
Next-gen BI isn’t the end of dashboards. It’s the beginning of decisions that make your business future-proof. Whether you’re working with Power BI dashboards or planning a full business intelligence strategy, the goal is the same: trusted, AI-powered insight.
At SeedGrowth Analytics, we provide business intelligence consulting across South Africa, helping organisations in Cape Town, Johannesburg and beyond to find their place on the Data Maturity Curve. Book a discovery call today and see how we can help you chart your path forward and graduate to the next level.
FAQs
What are the stages of the SeedGrowth Data Maturity Curve?
There are four stages:
Stage 1: Reactive Reporting
Stage 2: Organised BI
Stage 3: Strategic Analytics
Stage 4: Proactive Insight
Businesses progress from ad hoc spreadsheets to trusted models and, ultimately, predictive and AI-ready BI.
Who created the SeedGrowth Data Maturity Curve?
The SeedGrowth Data Maturity Curve was developed by SeedGrowth Analytics, based on real-world experience helping businesses overcome common BI challenges.
How does generative AI improve Business Intelligence?
It automates narrative explanations, flags anomalies, and produces executive summaries across models. This reduces analyst bottlenecks and turns dashboards into decision support.
What is natural language querying in BI?
Users ask questions in plain language and get real answers quickly. It expands BI adoption beyond analysts and speeds up decision-making across teams.
What is embedded BI and why does it matter?
Embedded BI puts insight inside tools people already use like CRM, ERP, and Teams. It reduces friction and supports adoption by making data available at the moment of decision.
How do forecasting and scenario modelling help executives?
Teams can predict outcomes with confidence intervals, test pricing or hiring plans, and blend internal and external signals like inflation. The result is proactive strategy rather than reactive reporting.
What are agentic workflows in BI?
AI agents move from insight to action by recommending or triggering tasks under human oversight. Examples include churn risk interventions, auto-generated purchase orders, and cash flow scenario options.
Should we jump straight to AI if our data is not fully trusted?
No. If trust is weak in the early stages of building out your BI, then adding in AI will amplify problems. Strengthen foundations first so AI becomes a growth driver rather than a liability.
How can we progress toward AI-powered Business Intelligence without rebuilding everything?
Get honest about your current state, pick one use case, shore up data governance and structure, and design for humans with natural language and embedded experiences.
When should we consider training support?
Training helps teams explore predictive and AI-driven insight with confidence. It equips people to experiment, learn, and shape where these tools add real value.
Rachel O’Connor is Co-Founder and runs Operations at SeedGrowth Analytics. She focuses on building people, process and purpose into the heart of the business so that data delivery is consistent, scalable and trusted across clients. Her interest is in how data gets used, how people make decisions, and what it takes to turn insight into action in real business environments. She writes about how organisations build clarity through disciplined execution, not just better tools. Connect on LinkedIn